Type to search
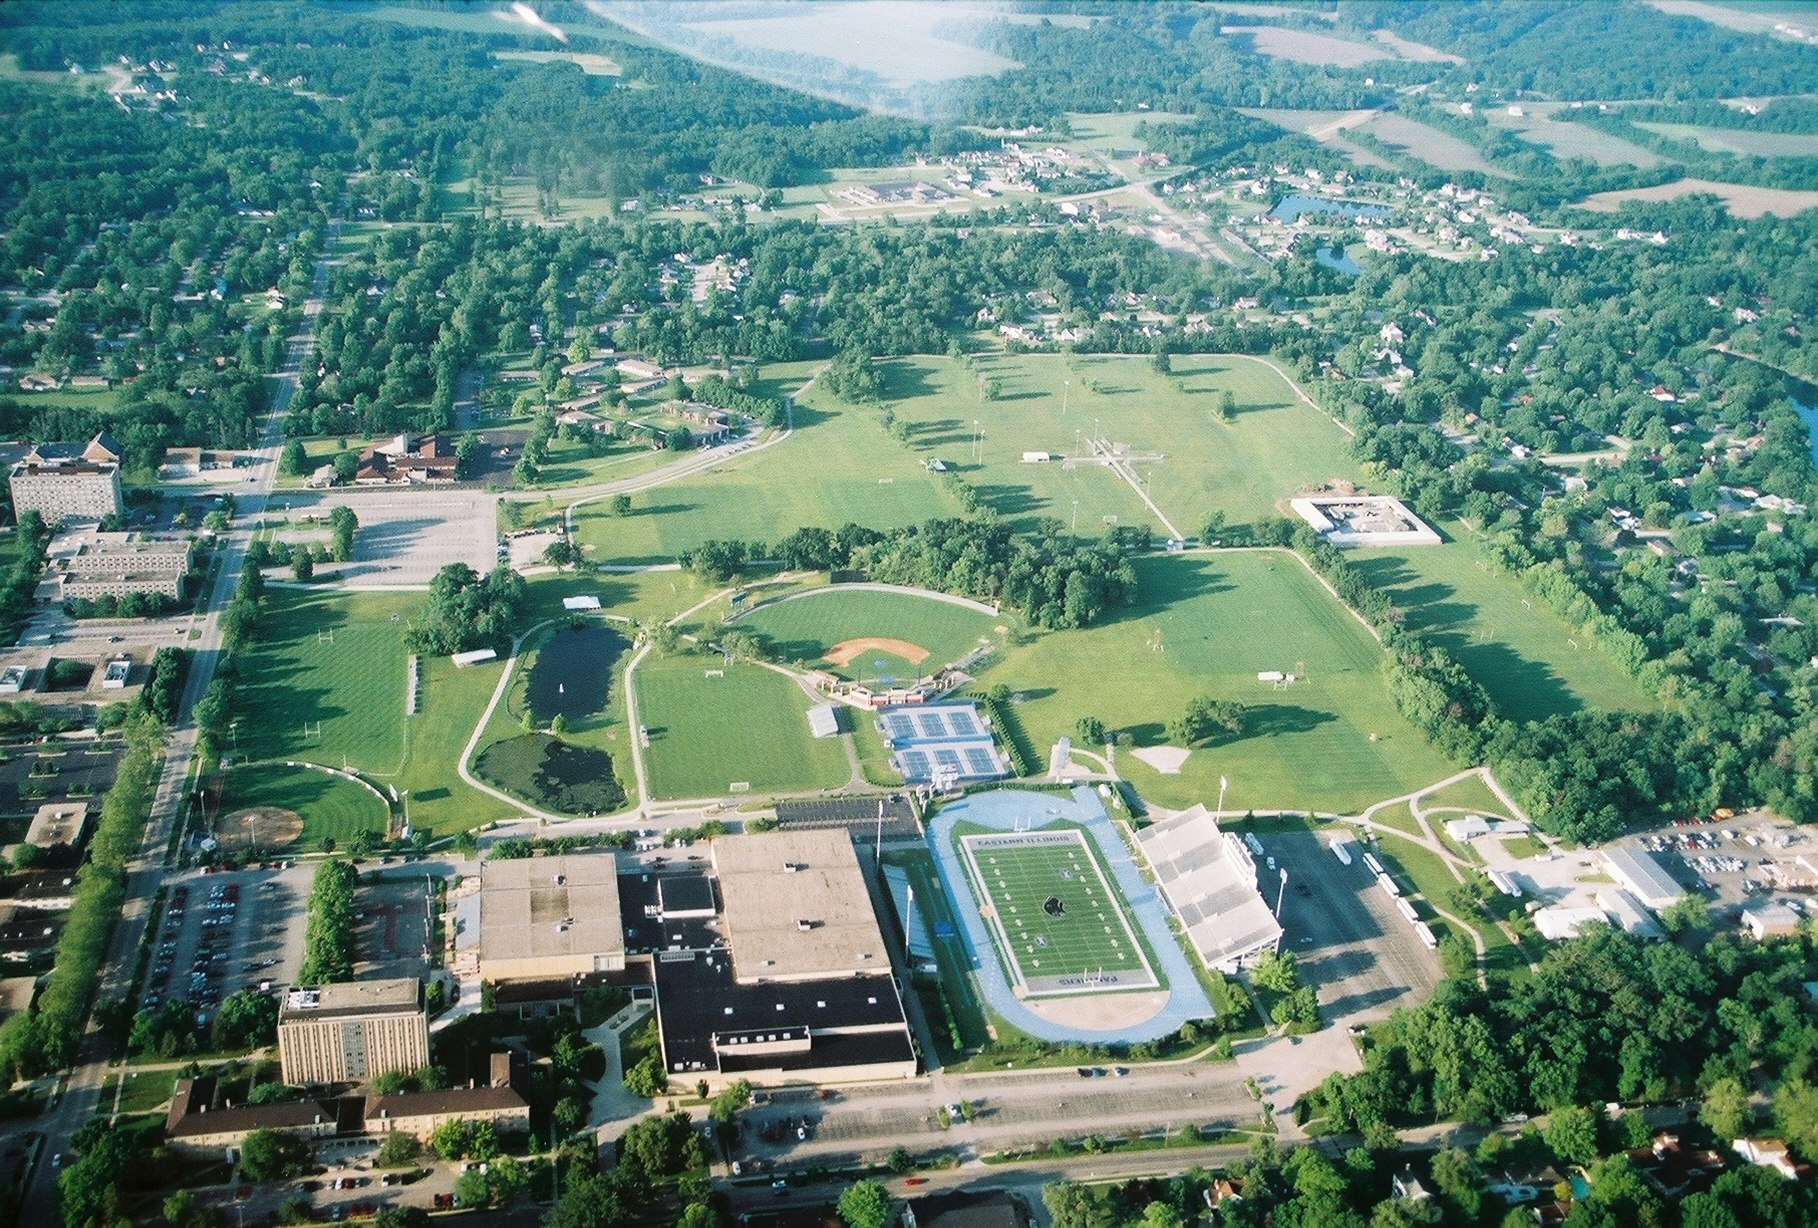
Eastern Illinois University
Charleston, Illinois•Public
Your chances
-
Acceptance rate
72%
Public school in Illinois with 6,900 total undergraduate students
Rural
Great Lakes
On campus housing
D1 Basketball
Ohio Valley Conference
600 Lincoln Avenue, Charleston, IL 61920
(217) 581-5000
Loading…
Admissions
Overall acceptance rate
72%
Yield rate - overall
15%
Acceptance rate breakdown
Women
74%
Men
67%
Applicant breakdown
Total number of applicants
7,145
Women: 60%
Men: 40%
Cost & scholarships
Your estimated net cost
$ ? / year
In-state
$23,913
Out-of-state
$26,340
Average net cost after aid
Income
Average net cost
$0–30,000
$9,498
$30,001–48,000
$7,854
$48,001–75,000
$12,381
$75,001–110,000
$18,148
Over $110,000
$19,335
Published costs and averages can be misleading: they don’t fully account for your family’s finances (for financial aid) or your academic profile (for scholarships).
Want to see your personalized net cost after financial aid and scholarships?
Applications
How to apply
Accepts Common App
Test optional
Rec letters optional
Considers class rank
TOEFL required (international applicants)
Tests typically submitted
SAT: 56%
ACT: 66%
Policies can change. Please confirm by looking at this school’s website.
Students
First-year enrolled students (full-time)
778
Student diversity
Moderately diverse
4-year graduation rate
35%
6-year graduation rate
52%
Retention rate
70%
Admission policy
Co-ed
International students
2%
Enrolled breakdown by gender
Women: 57%
Men: 43%
Race & ethnicity diversity
Among domestic studentsAsian and Pacific Islander
2%
Black
17%
Hispanic
11%
Native American
< 1%
Other
5%
White
64%
Academics
Student faculty ratio
13:1
Calendar system
Semester
Special academic offering
Study abroad
Offers graduate degree
Where does this data come from?
Similar schools

Indiana State University | ISU
Terre Haute, IN•94% accept rate

Lake Land College
Mattoon, IL

Lakeland Community College
Kirtland, OH

Lincoln Trail College
Robinson, IL

National Louis University | NLU
Chicago, IL•97% accept rate

North Central College
Naperville, IL•68% accept rate

Western Illinois University
Macomb, IL•72% accept rate