Type to search
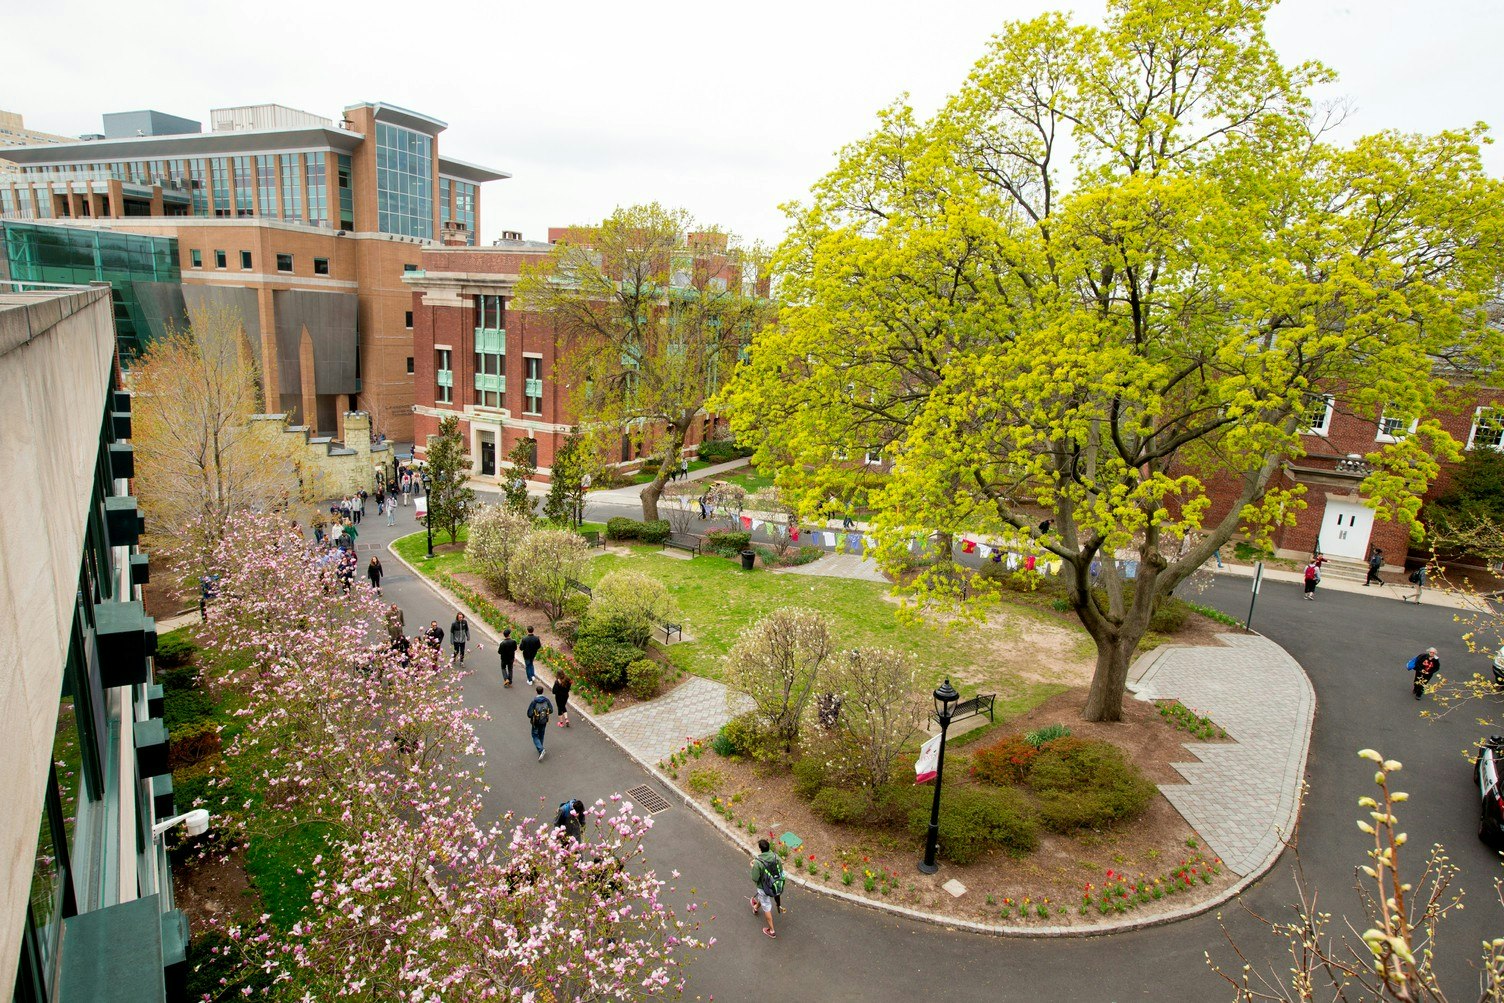
Stevens Institute of Technology
Hoboken, New Jersey•Private
Your chances
-
Acceptance rate
48%
Private school in New Jersey with 4,200 total undergraduate students
Suburban
Mid-Atlantic
On campus housing
1 Castle Point Terrace, Hoboken, NJ 07030
(201) 216-5000
Loading…
Admissions
Overall acceptance rate
48%
Yield rate - overall
21%
Acceptance rate breakdown
Women
50%
Men
45%
Applicant breakdown
Total number of applicants
10,671
Women: 33%
Men: 67%
Cost & scholarships
Your estimated net cost
$ ? / year
In-state
$85,606
Out-of-state
$85,606
Published costs and averages can be misleading: they don’t fully account for your family’s finances (for financial aid) or your academic profile (for scholarships).
Want to see your personalized net cost after financial aid and scholarships?
Applications
How to apply
Accepts Common App
Test optional
Rec letters required
Doesn’t consider class rank
TOEFL required (international applicants)
Tests typically submitted
SAT: 36%
ACT: 4%
Policies can change. Please confirm by looking at this school’s website.
Students
First-year enrolled students (full-time)
1,055
Student diversity
Diverse
4-year graduation rate
71%
6-year graduation rate
87%
Retention rate
94%
Admission policy
Co-ed
International students
4%
Enrolled breakdown by gender
Women: 33%
Men: 67%
Race & ethnicity diversity
Among domestic studentsAsian and Pacific Islander
20%
Black
3%
Hispanic
17%
Native American
1%
Other
13%
White
46%
Academics
Student faculty ratio
11:1
Calendar system
Semester
Special academic offering
Study abroad
Credit for AP and IB exams
Offers graduate degree
Academic and career counseling
Where does this data come from?
Similar schools
Binghamton University
Binghamton, NY•38% accept rate

Cooper Union
New York, NY•15% accept rate
New Jersey Institute of Technology | NJIT
Newark, NJ•69% accept rate
Princeton University
Princeton, NJ•4% accept rate

Ramapo College of New Jersey | RCNJ
Mahwah, NJ•70% accept rate
Rose-Hulman Institute of Technology | RHIT
Terre Haute, IN•77% accept rate
Villanova University
Villanova, PA•25% accept rate